The National Travel Survey for 2017 was published earlier today – it shows that cycling’s modest growth is being fuelled not by newbies but by hardcore cyclists.
"The NTS sample is not identifying more cyclists, but those in the sample have generally been making more cycling trips and travelling further," concludes the Department for Transport statistician in charge of the National Travel Survey.
While some parts of the UK have seen a cycling surge, others have not. This is reflected in the gloomy statistic that cycling nationally is stuck at two per cent of all trips, and just one per cent of distance travelled. This has hardly shifted in the last 20 years.
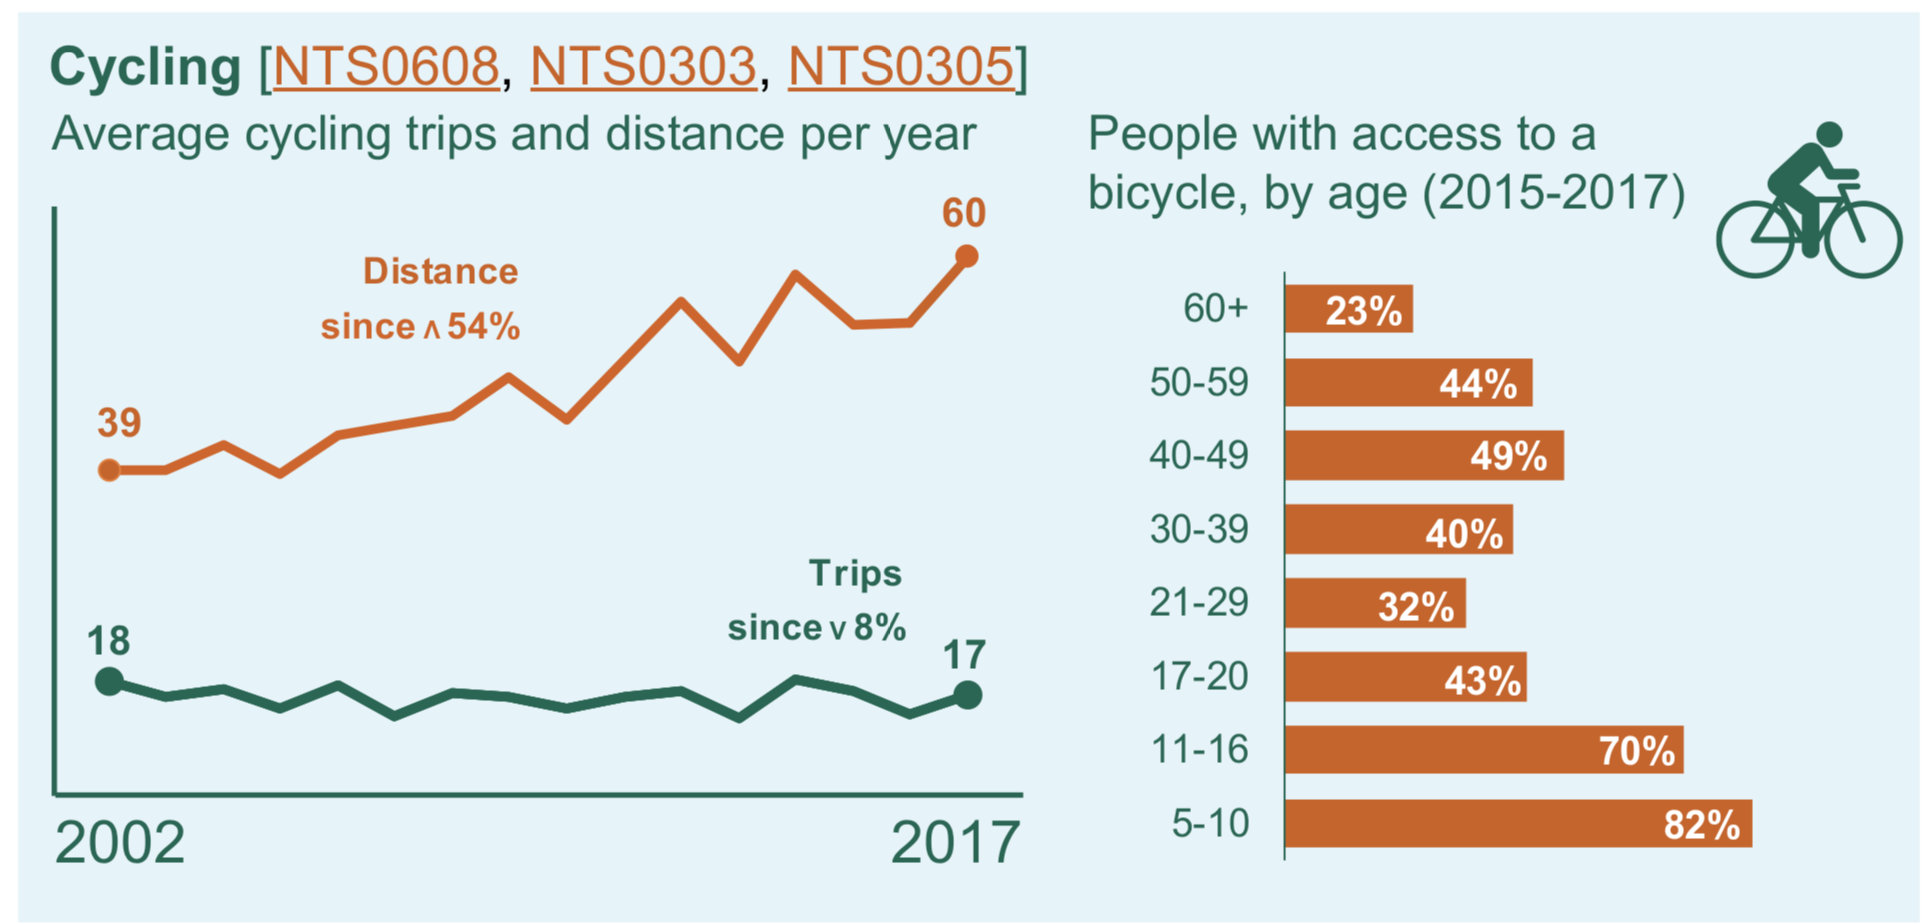
42 per cent of people had access to a bicycle in 2017, reports the survey, with young children having the highest rates of bicycle access at 82 per cent.
The average number of miles cycled in 2017 (60 miles per person) was 54 per cent higher than in 2002. People did an average of 17 trips per person per year in 2017, compared to 18 in 2002.
Around 14 per cent of people cycled at least once a week, and 66 per cent less than once a year or never, figures that have been broadly unchanged since 2003.
On average in 2017, keen cyclists made 332 trips per year (about 6 trips a week) and travelled around 1,144 miles per year, up from 687 miles on average in 2002. It’s good to see such a significant increase in miles cycled, but it’s not so good that the increase is coming from roughly the same people rather than new blood being attracted into cycling.
The survey also reveals that car use continues its decline – perhaps for demographic reasons, ie younger people are not driving as much as previous generations – but it’s shocking to see the graphs that show how even very short trips are usually undertaken in motor cars.
In 2017, 68 per cent of all trips were under five miles, yet driving remains the most frequent mode of travel. This, of course, also explains why traffic congestion is often so dire – too many people in cars.